
Where Should the Next Data Center Be Built?
A State-by-State Analysis of Energy Cost and Curtailment Opportunity

Why This Matters
A 10 MW data center consumes roughly 87,600 MWh per year. That’s enough to power about 8,000 homes.
At $90/MWh (Northern Virginia’s effective rate), that’s $7.9M per year in electricity alone. At $54/MWh (New Mexico’s industrial rate), it’s $4.7M. That’s a $3.2M gap — annually, for one facility.
Now multiply that by ten facilities, or a hundred. Energy cost isn’t a line item. It’s a strategic decision.
This analysis covers all 50 US states plus DC. The goal is simple: where are the best energy economics for data centers, and is the market actually going there?
Note on my previous blog: In my earlier post on this topic, I compared EIA industrial retail rates (all-in, ~$215/MWh in California) directly to CAISO wholesale prices (~$45/MWh). That was wrong. Retail includes delivery, taxes, and demand charges. Wholesale is energy only. You can’t compare them directly. I got called out on it, and rightly so. This analysis fixes that.
How the Pricing Works
There are two types of retail electricity markets in the US.
Regulated markets — a single utility owns the wires and sells you power. Your bill is bundled: energy + transmission + distribution + taxes, all in one rate. The EIA Form 861 industrial rate captures this accurately. No wholesale access.
Deregulated markets — you pay a utility for wire delivery (TDU charge, ~$30/MWh for large customers) plus a retail electricity provider (REP) for actual energy. REP margin is roughly $10/MWh in competitive markets. Large customers can also access index pricing, where the energy component tracks wholesale.
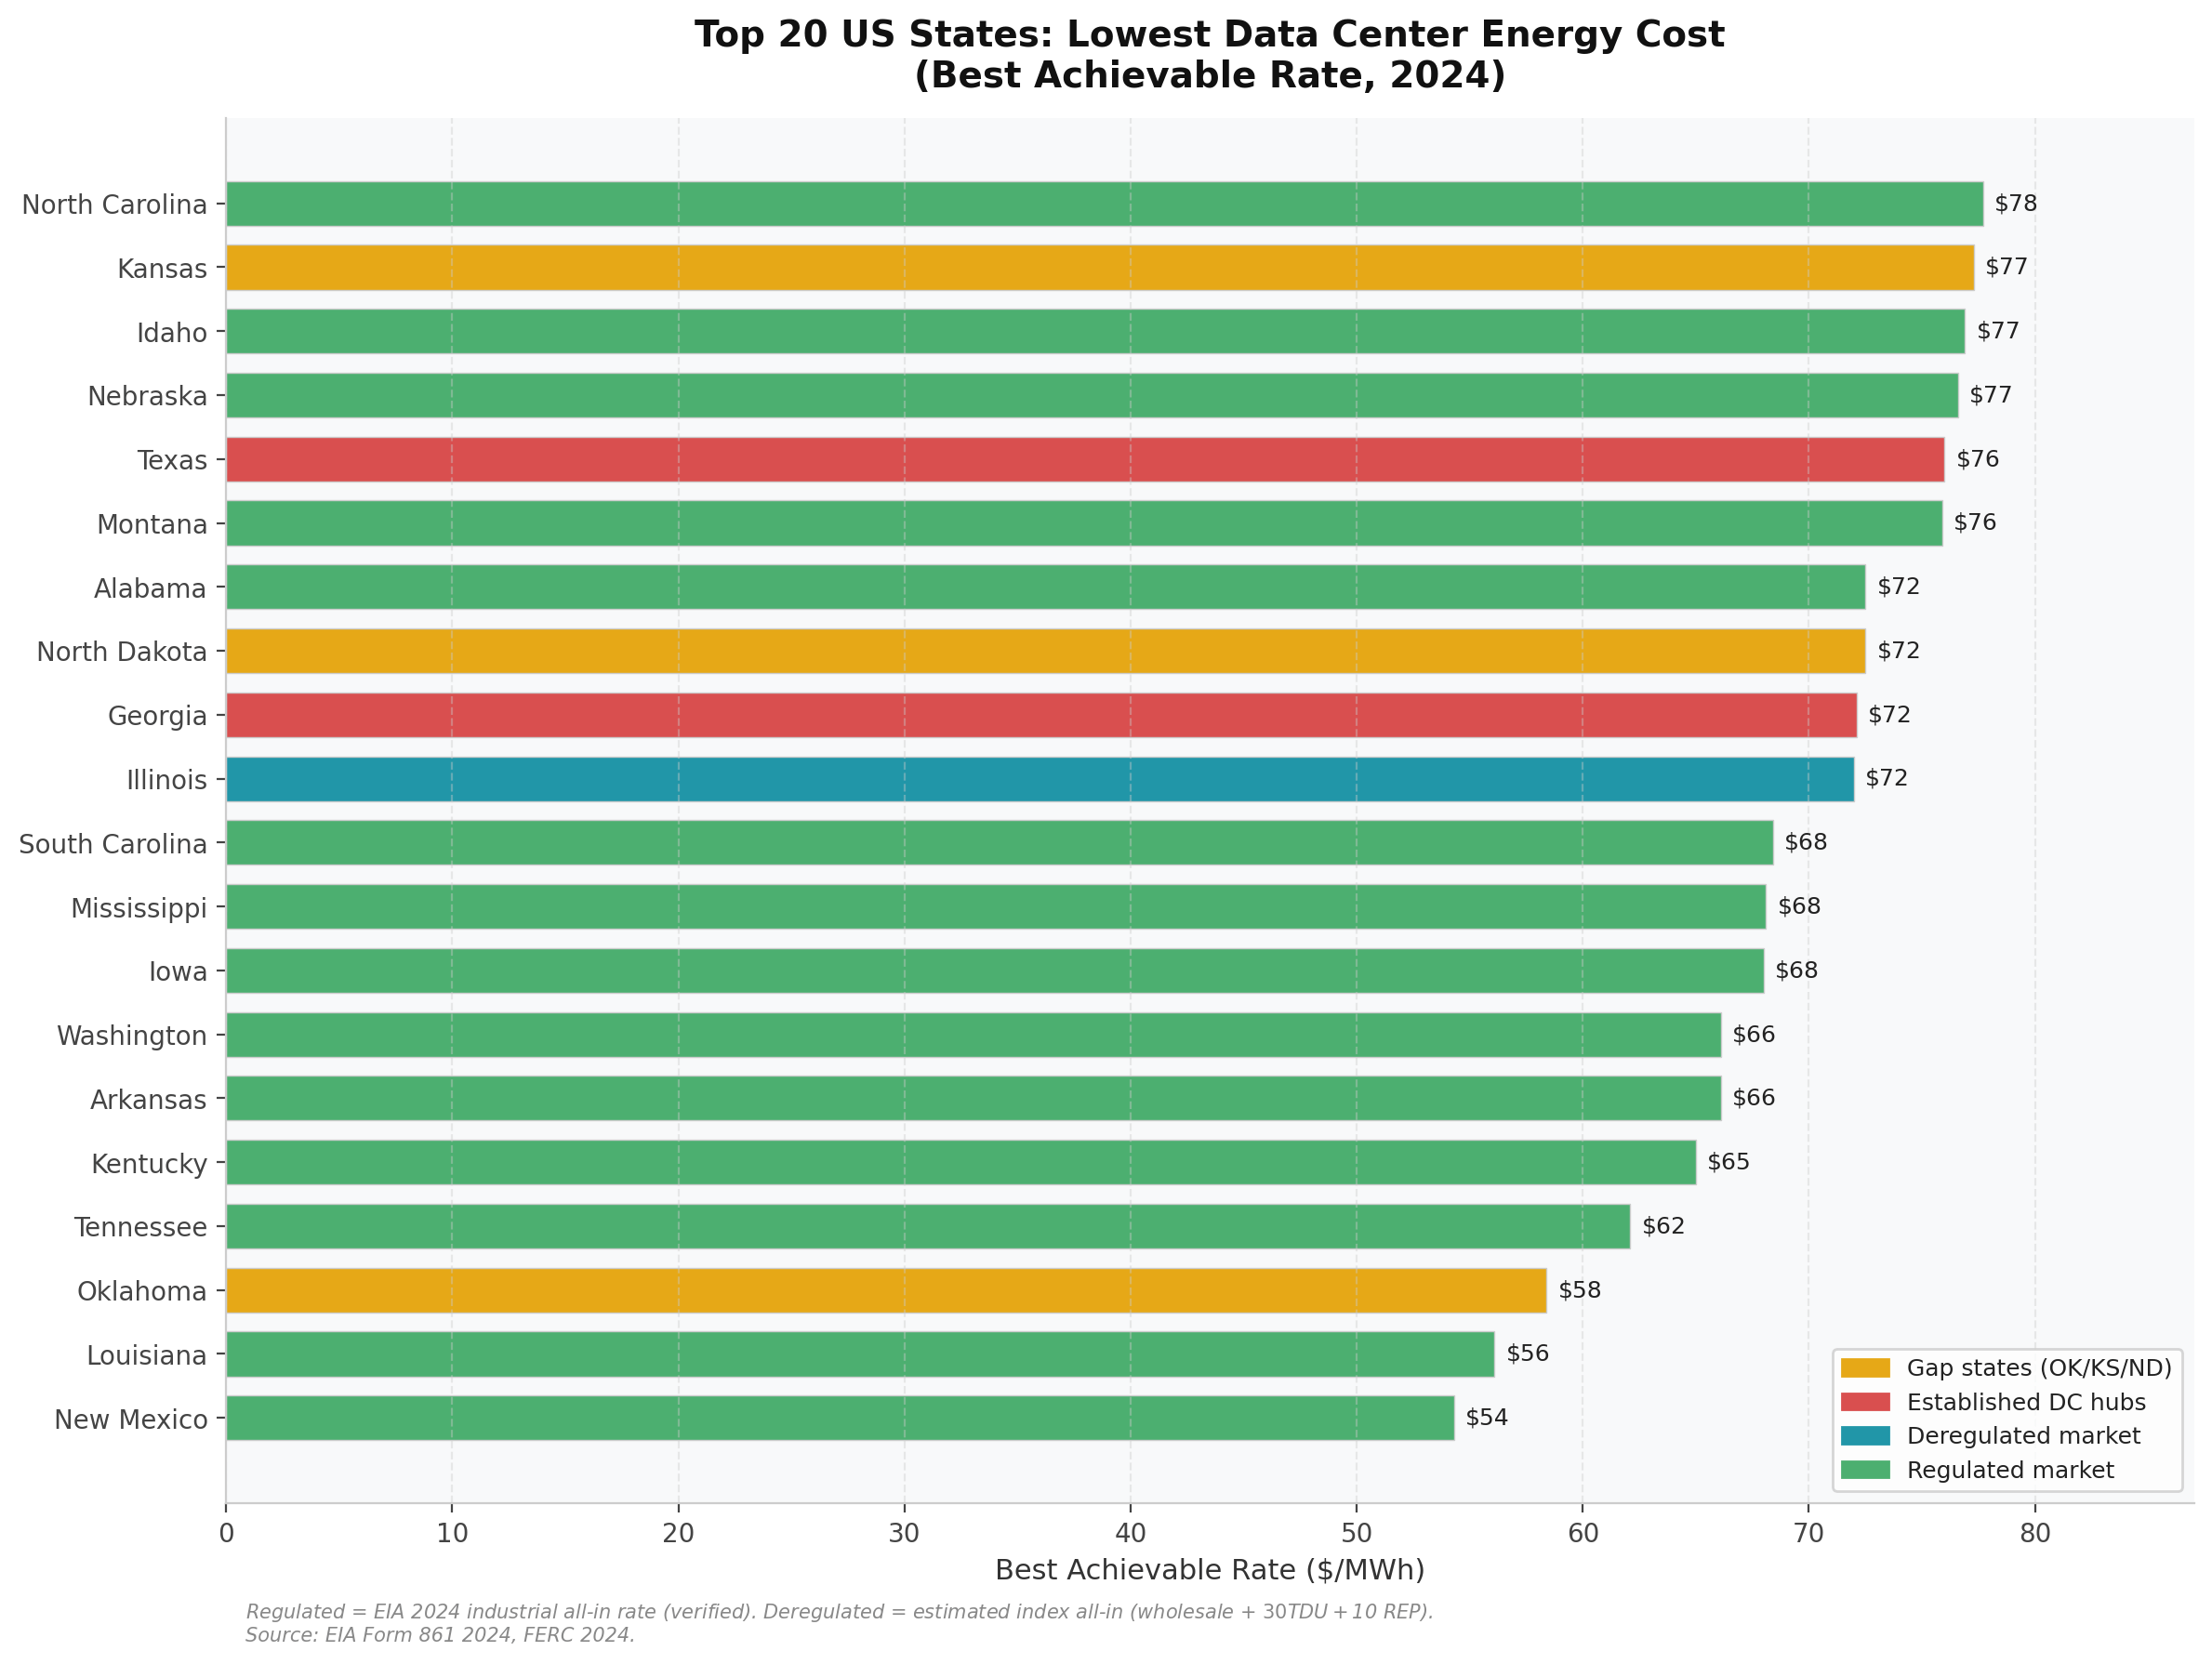
In this analysis, ‘Best Achievable’ means:
• Regulated states: EIA 2024 industrial rate (verified, all-in)
• Deregulated states: wholesale 2024 + $30 TDU + $10 REP margin (estimated)
Data source: EIA Form 861 (2024), FERC State of Markets (2024). Wholesale prices marked * are confirmed FERC 2024 hub prices; others estimated from regional ISO data.
The Data: Cost vs. Curtailment
The chart1 below plots each state by two variables: best achievable energy rate (x-axis) and renewable curtailment in 2024 (y-axis, GWh).
The ideal corner is bottom-left: cheap electricity and high curtailment. High curtailment means the grid is producing more renewable power than it can use. That’s stranded energy — and potentially a pricing opportunity for large flexible loads like data centers that can time-shift consumption.
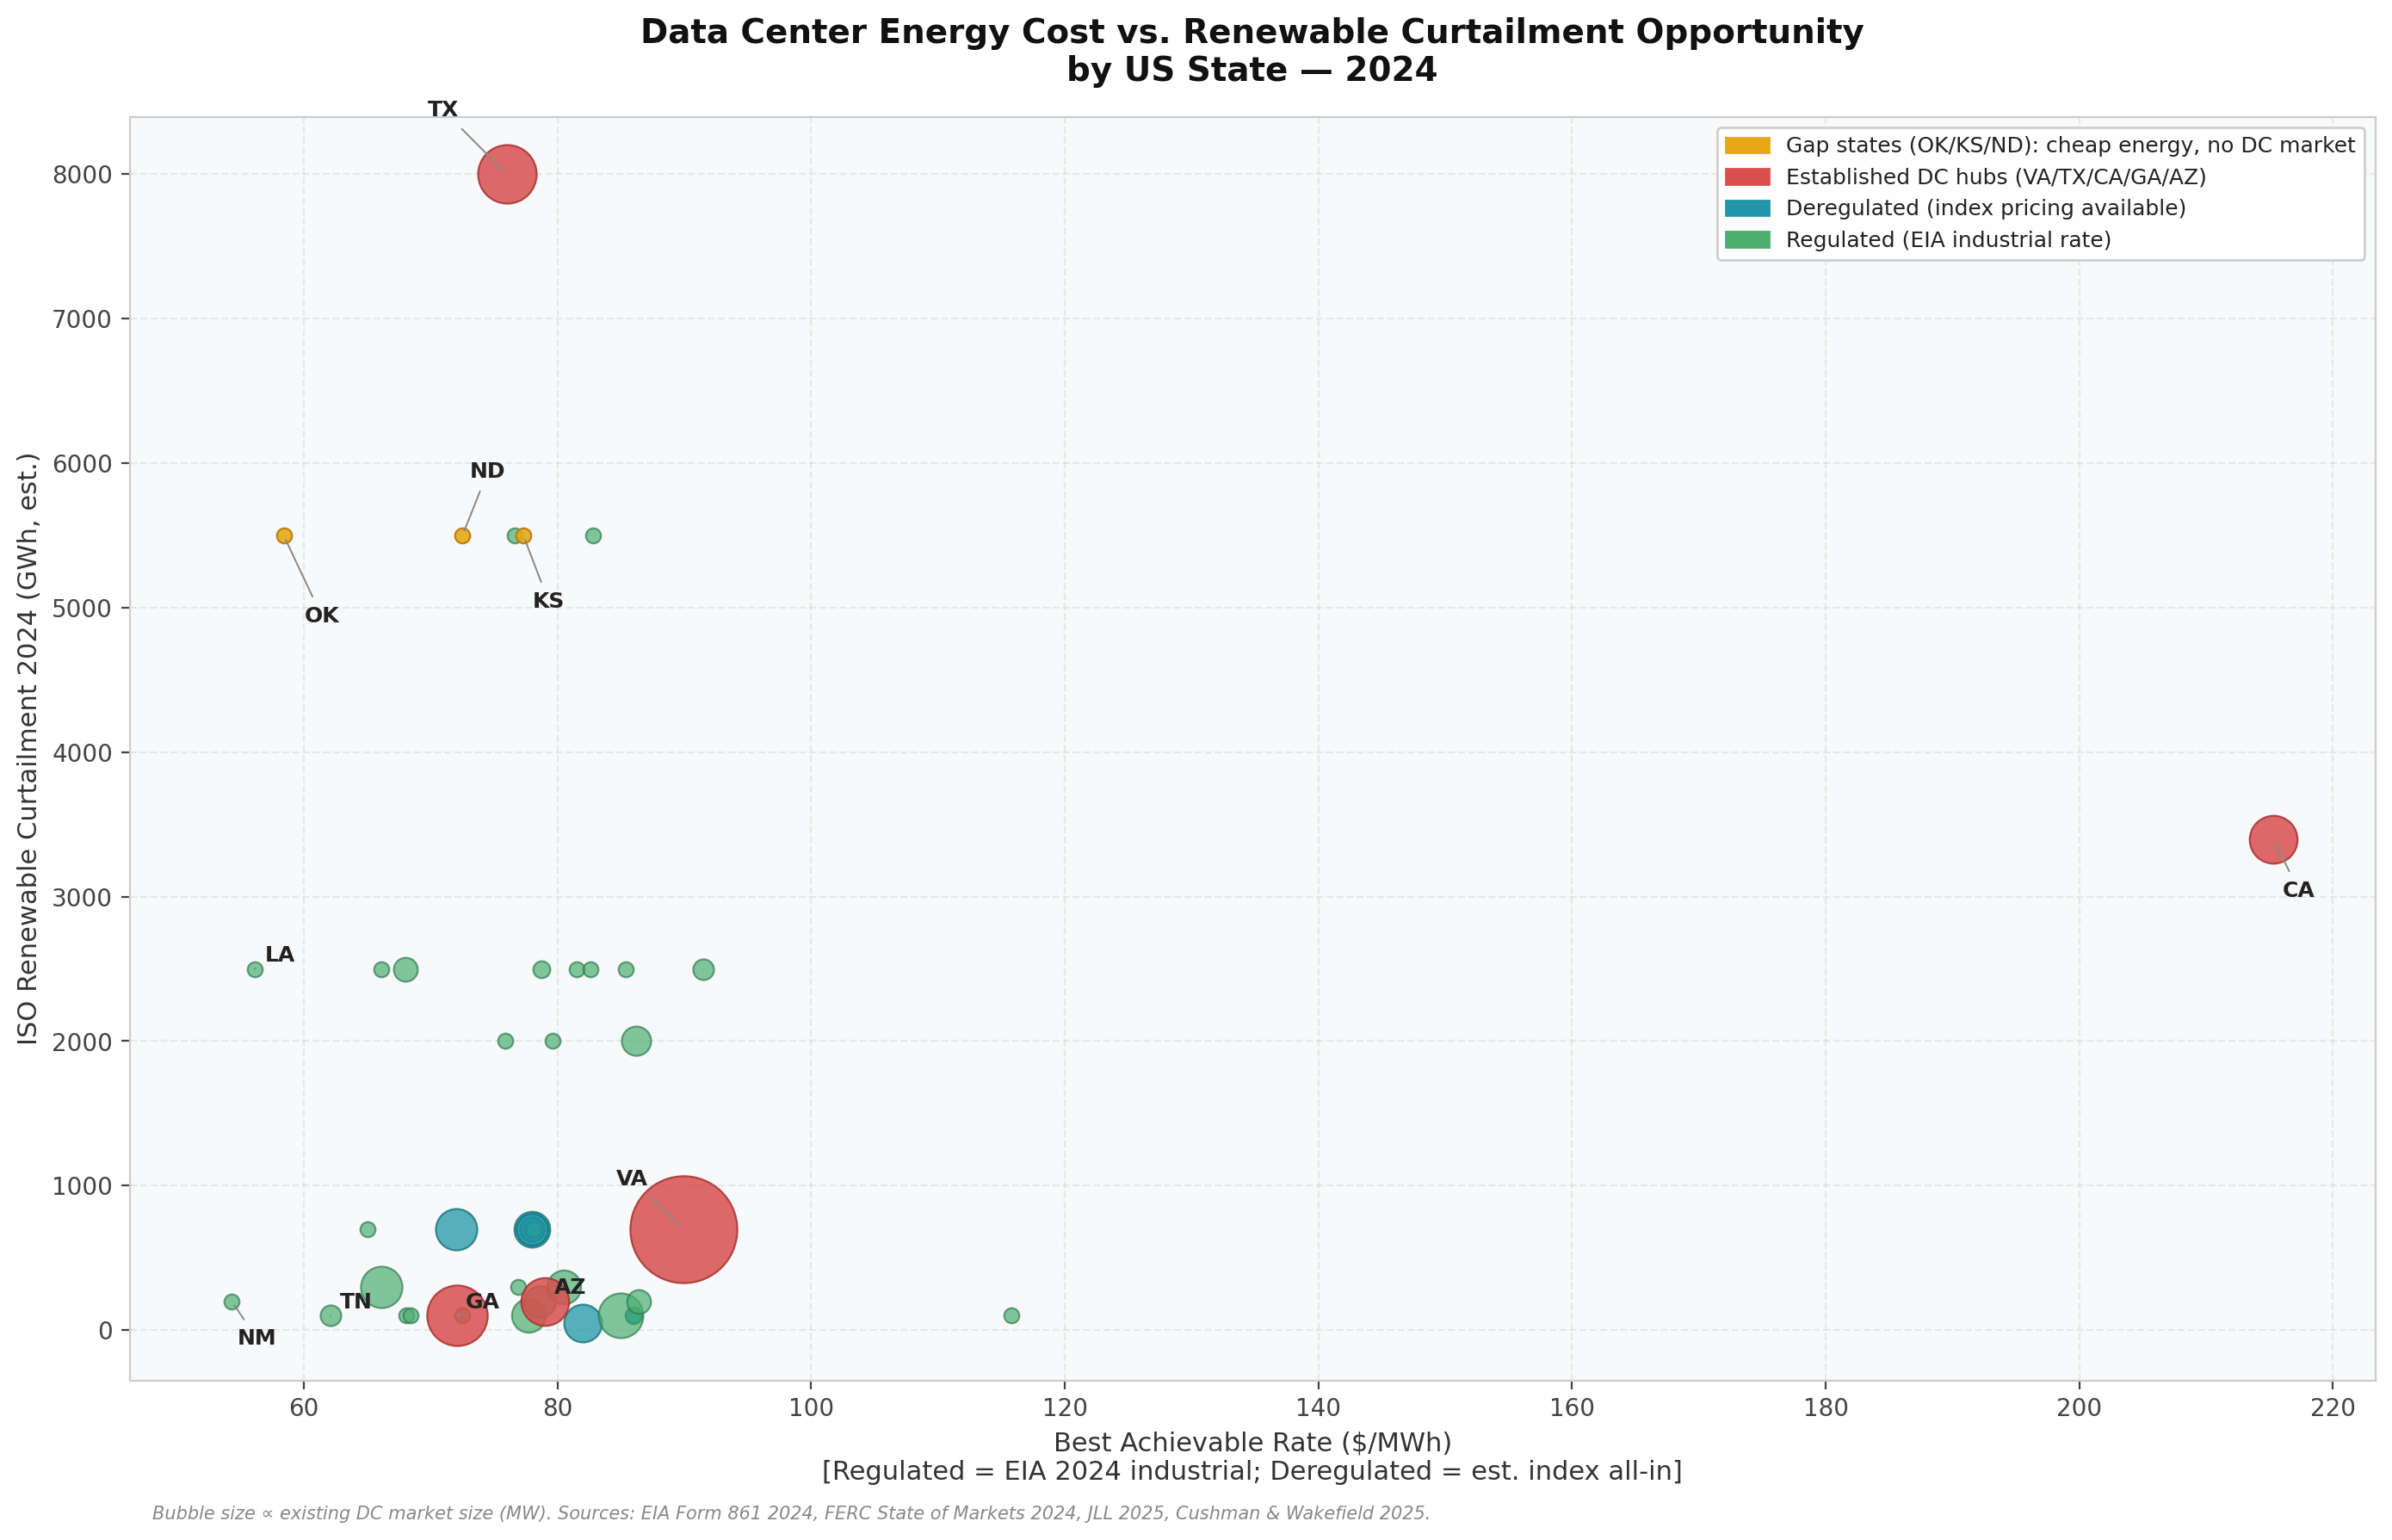
A few things stand out:
Virginia is expensive and not particularly green. At ~$89.9/MWh, it’s far from the cheapest. Yet it has the world’s largest data center market (4,040 MW installed, Q1 2025). More on why below.
Texas offers a reasonable rate. Estimated index all-in is ~$76/MWh. ERCOT curtailment was high in 2024 — mostly wind. The market is growing fast.
Oklahoma, Kansas, and North Dakota are in the best corner. Oklahoma: $58.4/MWh + ~21,000 GWh of SPP curtailment. Kansas: similar. North Dakota: cheap regulated rate, MISO curtailment. But there’s virtually no data center market in any of them.
California is the worst combination. $215/MWh industrial rate and CAISO curtailment is rising. You’re paying premium rates and the grid is still dumping excess solar. The curtailment there isn’t an opportunity — it’s a symptom of transmission constraints that retail customers don’t capture.
Is the Market Going Where the Energy Is?
Short answer: not really. At least not yet.
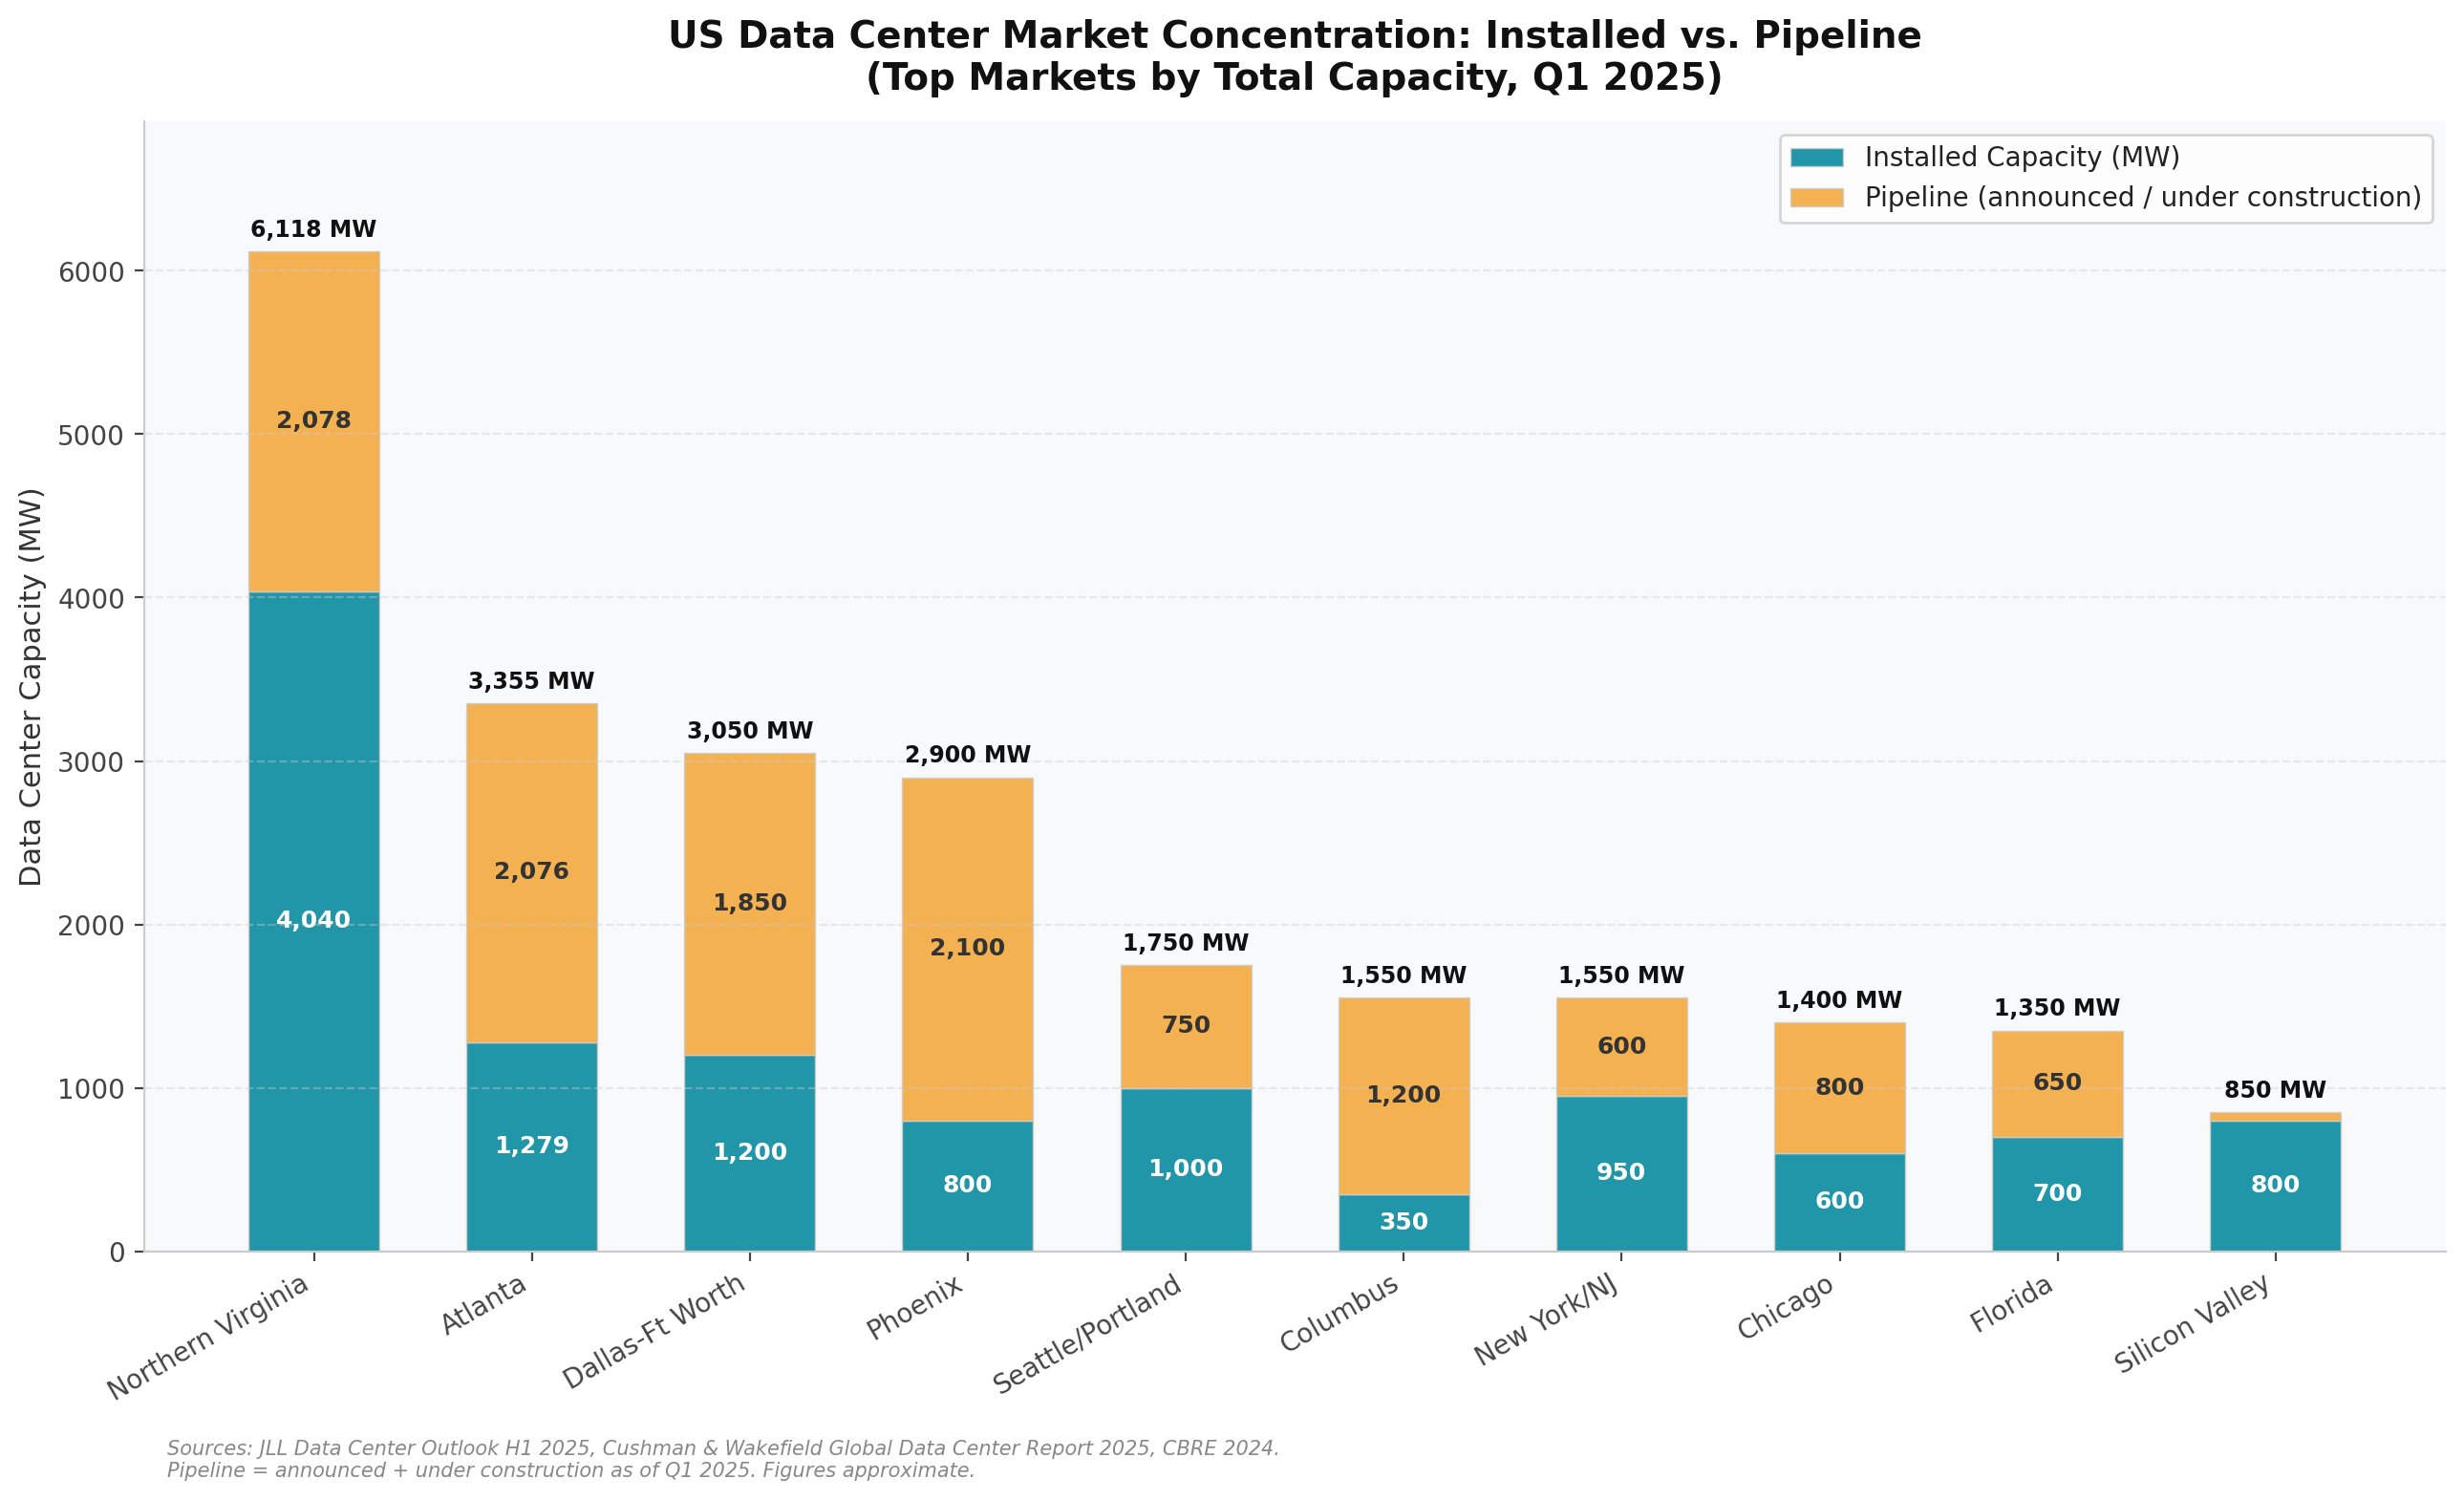
Northern Virginia still dominates. 4,040 MW installed. Another 2,078 MW in the pipeline. That’s roughly 40% of the US market concentrated in one region.
Phoenix is the surprise — moderate energy rates, but very low renewable content and minimal curtailment. Neither metric explains its pipeline. The growth is driven by land availability, fast permitting, and proximity to California — which at $215/MWh has effectively pushed new development out of state..
Texas (Dallas-Fort Worth) is growing fast and may pass Virginia within 5-7 years. Georgia (Atlanta) also has significant pipeline.
What’s missing: Oklahoma, Kansas, North Dakota. Combined data center capacity: near zero.
The Gap: Great Economics, No Market
Oklahoma, Kansas, and North Dakota rank in the top 10 for energy cost. High curtailment. Low rates. No ecosystem.
Why not?
Fiber and connectivity. Traditional data centers are interconnection hubs — multiple ISPs, cloud providers, and enterprise networks physically meet inside the building and exchange traffic. Northern Virginia’s Ashburn corridor is where a large fraction of US internet traffic crosses between networks. That peering density is the product for colocation customers. Oklahoma City has adequate regional fiber but nothing comparable as an interconnection point. For workloads where latency matters, this is a hard constraint. (See next section for why this changes with AI training.)
Proximity to demand centers. Enterprise and cloud workloads need to be near users. Finance, government, healthcare — the biggest buyers of data center capacity are on the coasts and in the Midwest metros.
Talent and supply chain. Data center operations require specialized technicians, security, and a vendor ecosystem. Virginia, Texas, and Arizona built this over 20+ years. Oklahoma has not.
Grid interconnection queues. SPP and MISO interconnection queues are long. Adding 10-50 MW of load can face multi-year timelines for firm capacity agreements, depending on the local utility.
These are real barriers. But they’re not permanent.
Why the Gap Won’t Last
The constraints above — fiber density, proximity to users, ecosystem — apply to latency-sensitive workloads: real-time transactions, content delivery, interactive applications. A colocation customer in finance needs to be inside Ashburn because their product depends on millisecond-level round trips.
They don’t apply to AI training.
Training a large model is a closed-loop compute job. You load the dataset once, run for days or weeks, and output model weights. No real-time user interaction. No peering hub required. The fiber you need is enough to move data in reliably — not a hyperconnected exchange point. The latency constraint that built the current market simply doesn’t exist for this workload class.
The same logic applies to batch scientific compute, genomics, large-scale simulation, and — most relevant to my own research — flexible digital demand that can time-shift to absorb renewable oversupply.
In my SSRN working paper (Compute as Virtual Transmission), I describe a two-layer framework where AI training workloads act as dispatchable load — absorbing curtailed wind and solar by running when the grid has excess and prices are low. Oklahoma and Kansas are textbook candidates for this model.
The formula: cheap land + cheap power + excess renewables + latency-insensitive compute = the next wave of data center location strategy.
We’re already seeing early signals. Meta’s $27 billion Hyperion investment is partly sited in Louisiana — a state with low industrial rates and Gulf Coast energy infrastructure. Google and Microsoft have announced data centers in Iowa and Indiana, moving away from historic coastal clusters.
Oklahoma, Kansas, and North Dakota are one or two infrastructure investments away from viability — specifically: fiber backbone upgrades and accelerated interconnection processes.
What This Analysis Doesn’t Cover
This analysis focuses on energy cost and curtailment. Those are the two variables I can quantify with public data. They’re not the only factors.
Water and cooling. Data centers use large amounts of water for cooling. Western states (Arizona, New Mexico, Nevada) have low energy rates but chronic water stress. A 100 MW hyperscale facility can consume 1-3 million gallons per day. That changes the real cost.
Tax incentives. Virginia, Georgia, and Texas have data center-specific tax abatements — sales tax exemptions on equipment, property tax deals. I don’t have a reliable cross-state comparison for this, but it can materially shift effective costs.
Permitting and interconnection timelines. A state with cheap power but a 3-year interconnection queue may not be viable in practice. MISO and SPP have had significant backlogs.
Disaster risk. Tornadoes, hurricanes, floods, wildfires, and seismic activity all factor into site selection. Oklahoma is in a tornado corridor. Gulf Coast sites are hurricane-exposed. These affect insurance costs and resiliency design.
Demand charges. For regulated utilities, demand charges (based on peak kW draw) can be a significant fraction of total cost for large industrial customers. The EIA Form 861 industrial averages blend demand and energy charges, but the actual split varies by utility tariff and can matter for facilities with flat, high constant load profiles.
A fuller analysis would score each state across all of these. I plan to extend this in a follow-up post.
The Main Point
The data center industry is not located where energy is cheapest. It’s located where the ecosystem, connectivity, and customer proximity made sense 15-20 years ago.
That calculus is shifting. AI training is latency-insensitive. Renewable curtailment is growing. Energy costs are more material as facility sizes scale from 10 MW to 500+ MW campuses.
The states with the best energy economics — New Mexico, Oklahoma, Kansas, Louisiana, Tennessee — are underrepresented in the current market. Some will attract significant investment over the next decade. Others won’t, because energy cost alone isn’t sufficient.
What determines which ones win is whether they solve the secondary constraints: fiber, talent, water, and interconnection speed.
That’s the question worth tracking.
Related: “Compute as Virtual Transmission” (SSRN, 2025) — two-layer framework for reducing renewable curtailment through flexible digital demand.
Data and methodology: Full state-by-state spreadsheet available on request. Sources: EIA Form 861 (2024), FERC State of Markets (2024), JLL Data Center Outlook H1 2025, Cushman & Wakefield Global Data Center Report 2025, Modo Energy, Amperon.
Note: Deregulated index-pricing estimates are based on 2024 hub wholesale prices plus standard TDU and REP margin assumptions. Actual index rates vary. Regulated rates are EIA 2024 verified. This is not investment or site-selection advice.
Curtailment figures are reported at ISO level (SPP, MISO, ERCOT, etc.), not individual states. State-level attribution is estimated. Oklahoma and Kansas both fall under SPP; North Dakota under MISO.